[soundcloud url=”https://api.soundcloud.com/tracks/129652019″ params=”color=ff6600&auto_play=false&show_artwork=true” width=”100%” height=”166″ iframe=”true” /]
I’ve been asked questions via email and twitter about the acoustic measurements in the Inchindown oil storage tank, and so this blog is meant to answer some of those. If you have any questions, feel free to post them below and I’ll try and answer them.
Update June 2016
I’ve just returned to the tanks for a BBC 4 recording. This gave me an opportunity to measure the temperature and relative humidity in the tanks. At high frequency the reverberation time is dominated by the effects of air absorption, and to calculate this properly you need to know how much water vapour there is and the temperature. In the middle the values were 8.8 ºC and 83.8 %RH. When I wrote a scientific paper about the measurements I had to estimate the values based on the reverberation time measurements. My estimates of 10 ºC and 90 %RH were pretty good!
Why is the record for the ‘longest echo’ when the correct technical term is reverberation?
Guinness World Records calls it the ‘longest echo’ because that was the name of the record I broke. I did suggest they should change the name for the record to be more correct. The guidelines for the record asked me to measure the broadband reverberation time. So I did a measurement using the international standard ISO-3382.
What equipment did you use?
See my previous blog entry where you can also download the impulse responses.
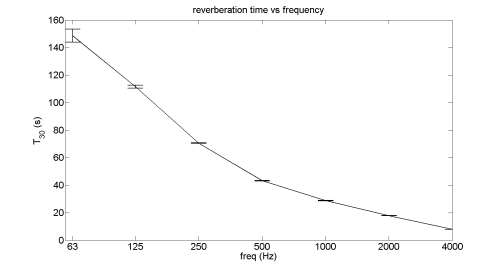
How does the reverberation time vary with frequency?
| Centre frequency (Hz) | 125 | 250 | 500 | 1000 | 2000 | 4000 |
| T30 (s) | 112 ± 1 | 70.4 ± 0.3 | 43.2 ± 0.2 | 28.8 ± 0.2 | 17.8 ± 0.1 | 7.89 ± 0.07 |

How did you calculate the record time of 75 seconds?
Guinness World Records wanted a single decay time across all frequencies. There are no standard methods for ‘averaging’ reverberation times across frequency, consequently a value was just calculated from the broadband impulse responses. Averaging all six measurement positions gave a value of (75±2) seconds.
Acknowledgement
Thanks to Paul Malpas, Director of Engineering Acoustics Design for doing an independent analysis of the recordings to check the calculations.
Notes
[1] The measurements were stopped when the decay could no longer be heard. For the 63Hz and 125 Hz octave-band the background noise floor of the measurement was never reached. Unfortunately, measurements were stopped too soon so there is an underestimation of T30 in 63Hz octave band. (The T20 =163±4 and EDT = 163±3s).
Follow me
0 responses to “An acoustic analysis of the World’s 'longest echo'”
[…] be heard for 112 seconds after the gunshot, but the broadband reverb time was 75 seconds. This blog post also explains the scientific method he used to set up and calibrate his […]
Reblogged this on eidoscognitio.
[…] testing. Trevor Cox made a particularly interesting example of this when he recently measured the longest reverb ever. My plan was to try and find an underwater IR and try this to find out what it actually sounds […]
[…] moan of a Wave Organ to the longest reverberation in the world, formed in the vast emptiness of Inchindown oil storage tank, Scotland. For my own part I chose to consider and discuss the relationship between sound, memory […]
[…] I am sitting in a room is a piece of experimental music composed by Alvin Lucier in 1969. The work is fascinating to me, because the acoustic of the room is at the heart of how the music evolves during the work. Given the importance of the room to how the music sounds, I wanted to see how it would sound in the extraordinary acoustic of the Inchindown oil tanks that recently got the World Record for the ‘Longest Echo‘. […]
[…] But what about the walls and other surfaces of an enclosed space? With lots of jutting angles to break up the waves, you might expect that good solid walls and objects help to bring down the noise. Again, though, solid walls are good [reflectors of sound](http://acousticstoday.org/10-world-sound-reflection-refraction-principle-least-time/), acting much like how a mirror would for light. While walls are good for redirecting sound, they aren’t that great for getting rid of it. With only solid walls and air for absorption, sound can [reverberate for a startlingly long time](https://acousticengineering.wordpress.com/2014/01/31/an-acoustic-analysis-of-the-worlds-longest-echo…). […]
[…] The reverberation time in spaces we encounter is typically between 0.5 – 2 seconds, yet a few years ago, the record was broken for the world’s longest reverberation time measurement. In an oil storage tank in Scotland, acousticians measured a 75 second reverberation time! […]
[…] with the World record reverb. After warming up in Salford’s anechoic chamber. More on the World record tank or Chapter 1 of Sonic Wonderland/The Sound […]