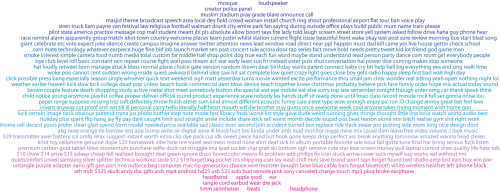
Over the summer, blogger burrsettles published a graph entitled On Geek versus Nerd. Based on mining tweets, it shows which words people associate with Geeks and which words are associated with Nerds. I thought I’d have a play with doing an audio equivalent, and hence this is about Headphones vs Loudspeakers.
What I did
Between July and December 2013, every week or so I used the twitter search api to retrieve tweets from the previous 7 days that included either the word ‘loudspeaker’ or the word ‘headphone’. In the end I had 17838 headphone tweets and 7050 loudspeaker tweets. I separated out all the other words mentioned in the tweets and cleaned them up e.g. collating synonyms like “amplifier” and “amp”. I also removed rare words, ones that appeared in less than 0.1% of tweets. This left me with 857 words.
I calculated the probability of words appearing in tweets with ‘loudspeaker’. And then the probability of words appearing in tweets with ‘headphone’. I then plotted the probabilities against each other. This graph was difficult to read with too many words sat on top of each other, so I produced a transformed infograph based on the probabilities. You’ll have to click on it to enlarge it.

How to read the graph:
- To the right are words that are more commonly used in the tweets, e.g. “audio”, “music” and “sound”
- To the left are words least commonly used in the tweets, e.g. “luck” and “child”
- The dashed line indicates words used equally often in tweets with “headphone” and “loudspeaker”
- Towards the top are words more often exclusively paired with “loudspeaker”, for example “mosque” and “stadium”.
- Towards the bottom, are words more often exclusively paired with “headphone”, e.g. “headband” and “earbud”.
For me, the main thing this graph illustrates is the trend towards headphones being fashion items because many of the tweets about headphones are to do with marketing and include brand names such as “dre”, “sennheiser”, “skullcandy”, “mac” and “philips”, and prices. The only brand I’ve spotted so far in the loudspeaker half of the plot is “Walmart”.
What can you see in the infograph? Feel free to comment below if you spot anything I can look into further.
Next I used a machine learning algorithm on Easy Text Classification to look at the sentiments portrayed by each of the tweets. This great tool predicts whether a tweet is positive, neutral or negative. So for example this tweet: “finally new headphones #yes #headphones #music #life #pink #great #fun #funny #abouttime #awesome” is classified as being positive, whereas this one “people who knot headphone and charger cables should just die #annoying” was classified as being negative. Overall, there were most positive tweets about headphones (25%) than loudspeakers (20%). Maybe a sign of more marketing tweets about headphones? Or people tweet more positive things about fashion brands they buy into? What do you think?
More detail on the method
The tweets were mined in MATLAB using Twitty. I looked for plurals of the keywords and also searched with and without a hash e.g. ‘#headphone’ and ‘headphone’. Retweets and duplicates were removed. When I cleaned up the list of words, this is what I did:
- I ignored short words.
- I removed all punctuation e.g. “don’t” became “dont”.
- I removed hashes e.g. “#music” because “music”.
- Using a lexicon of common English words I removed uninteresting common words e.g. “the”.
- I removed any characters and URLs except simply smileys.
- I removed any word that didn’t appear in more than 0.1% of tweets.
- I removed all words that were just digits.
- Using a list of synonyms, I reduced the number of words: e.g “amplifier” became “amp”
- I collated together plurals and singular words e.g. “amps” and “amp”, being careful not to change meaning e.g. “beat” and “beats”
- I collated together the same word but different tenses e.g. “pass” and “passed”
It might have been better to have used pointwise mutual information as was used in Geek vs Nerd. But I didn’t know the background probability of the words in Twitter. The infograph uses a rank order of the probabilities to space out the words onto the image so that words don’t overlap. In the centre of the graph, there were just too many words to be placed on one single line so the vertical difference isn’t significant between adjacent lines near the dashed line.
0 responses to “Headphones vs Loudspeakers”
[…] Headphones vs Loudspeakers (acousticengineering.wordpress.com) […]
[…] and engineers, hope you don’t mind. I’ve been some twitter mining recently, see Headphones vs Loudspeakers, and I thought it would be fun to pit Scientists vs […]
Very interesting comparison of headphones and loudspeakers. This is the first time, I saw such a graph. Great resource here.I am hooked 🙂
[…] the whole Apple vs Microsoft debate!). Headphones naturally are a more desirable accessory to own (as written about by a blog from Trevor Cox when comparing public perceptions for headphones vs loud…), so I guess part of this comparison between companies could be to do with the background of the […]
Wow this is so interesting to read and I am thrilled by your method to compare headphones and loudspeakers. Just came across your blog and found this helfpul piece of info. Thank you!
A very interesting read. Definitely put a lot of effort into this.
Wow I didn’t know software like that exists. Wouldn’t scarping all those tweet require a powerful computer and very fast internet? Or maybe I’m just missing something.
BTW this is a great way of spotting and predicting trends.